Director’s Note: Blackburn Bay – a sometimes overlooked bay segment
There is typically quite a bit of attention paid to conditions in Palma Sola Bay, the open waters of Sarasota Bay proper, Roberts Bay, and Little Sarasota Bay. In contrast, Blackburn Bay doesn’t get as much attention, which is a bummer, because it has a neat story to tell as well. First off, here is the multi-parameter Ecosystem Health Report Card for Blackburn Bay over the past 18 years.

Similar to the other lower bay segments, Blackburn Bay shifted into the yellow cautionary zone back in 2013. Yes, water quality was worse (dipped into red) back in 2019, but it had had troublesome scores for several years before then. Potential reasons for the decline in the health of Blackburn Bay become clearer when looking at the concentration of Total Nitrogen (TN) over the past 25 years.
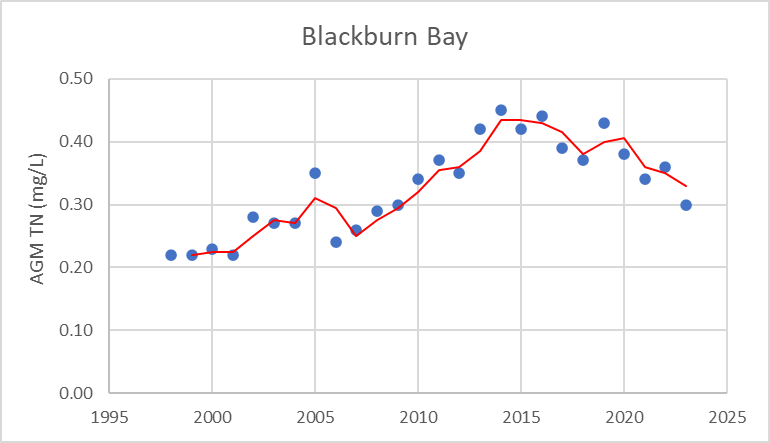
As can be seen, there was an overall increase in TN concentrations in Blackburn Bay between for about a decade, until about 2016 or so, followed by declines the past four to five years. What could account for that trend of values getting worse, then better? Well, we don’t know exactly. The direct watershed for Blackburn Bay receives discharges from South Creek, which is mostly natural (including Oscar Sherer State Park). But Blackburn Bay is also impacted by flows out of Cow Pen Slough during incoming tides.
We do know that the worst water quality and ecosystem health scores in the lower bay occurred during a period of about seven years (2013 to 2019) when the vast majority of our over 1 billion gallons of wastewater overflows occurred. However, the past four years have seen a substantial reduction in the amount of wastewater overflows into our bay – which we believe is the main reason why our water quality has recovered so much in the lower bay.
Extra nitrogen can give rise to more phytoplankton, the floating microscopic algae that turn bay waters green. And the worst year for phytoplankton in Blackburn Bay, 2016, is the year with the second highest TN concentration. But one of the parameters that also seems to show a similar pattern of degrading and improving trends is the amount of macroalgae, which is now measured at six stations along each of five transects that are each visited twice a year in Blackburn Bay -

Over the past three years, the amount of macroalgae on the bottom of Blackburn Bay has been quite low – enough to make it into the “blue” range for good conditions. That doesn’t mean that there is no macroalgae in Blackburn Bay, but for the five randomly chosen transects with six stations per transect, the amount of macroalgae we’ve encountered covers less than 25% of the bottom – much less than was the case back in 2013 to 2020 or so.
So why should we care? Well, reduced nitrogen in the water is likely the reason why the phytoplankton and macroalgae are lower now than their peak values five or so years ago. And that should help us with our anticipated seagrass recovery, to be verified (or not) when the 2024 maps come out.
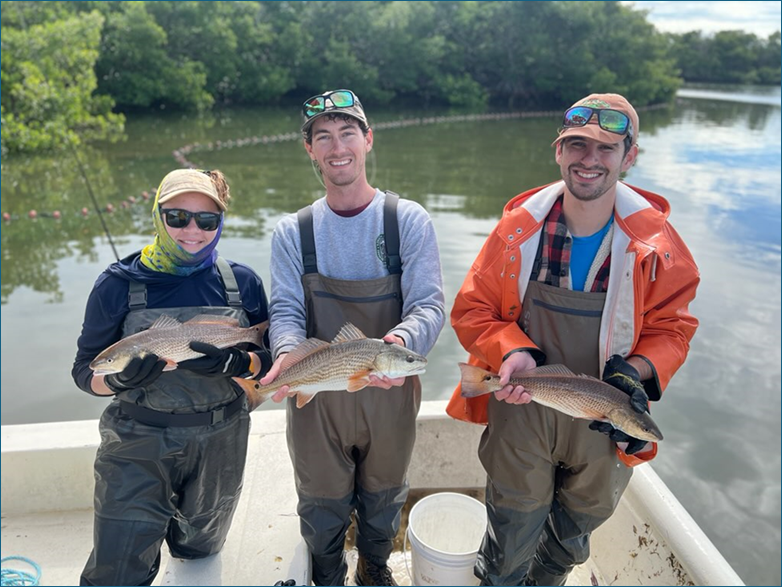
Better water quality, reduced macroalgae and – hopefully – more seagrass should be good news for our marine life too, right? Well, I’ll leave you with this picture of our friends and colleagues with the Florida Fish and Wildlife Conservation Commission (FFWCC). This photo shows three nice-sized redfish (Sciaenops ocellatus) collected in Blackburn Bay by seine nets (seen in the background) during FFWCC’s February 2024 sampling event.
We are accumulating more and more data that support our contention that the bay’s heath continues to improve, which also gives us more reasons why we need to make sure these positive trends don’t slip away from us in the future.