Hurricane Ian’s Impact on Sarasota Bay
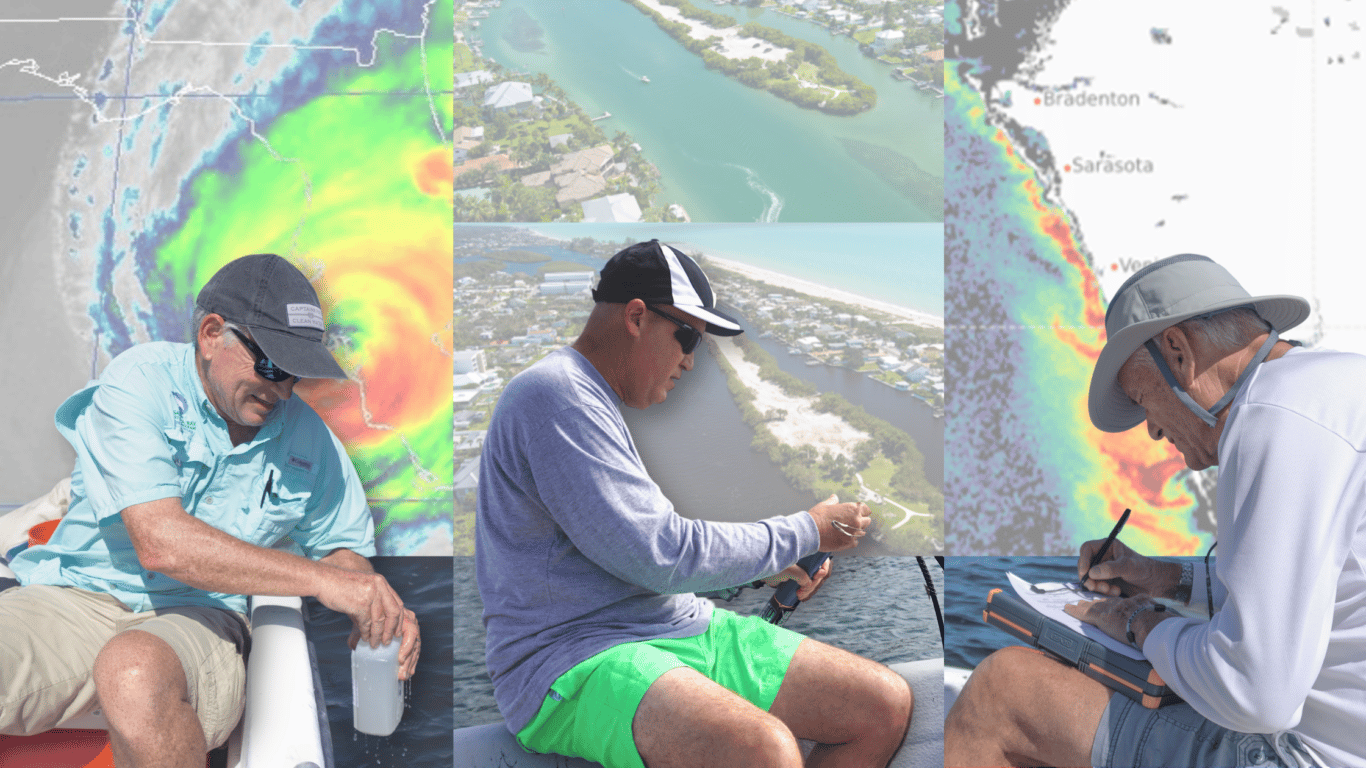
As the Gulf Coast continues to recover from Hurricane Ian, SBEP has been working with Charlotte County, the Coastal and Heartland National Estuary Partnership, the Florida Fish and Wildlife Conservation Commission, the Southwest Florida Water Management District, Environmental Science Associates, and Benchmark Laboratories to design and implement a monitoring program that would measure the human health risks associated with impacts from Hurricane Ian, as well as the impacts to the health of Sarasota Bay, Lemon Bay, Charlotte Harbor, and the Peace and Myakka River watersheds.
Less than a week after Ian made landfall (September 28th), the team was out at several sites in lower Sarasota Bay from Siesta Drive down to the Venice Inlet and in Lemon Bay to sample for:
- Temperature
- Salinity
- Oxygen
- Bacteria
- Amount of nutrients
- Amount of organic matter that can build up and cause later problems with oxygen
Hurricane Inputs
Hurricanes and large storm events can bring extreme change and devastation to coastal areas and estuaries. Not only do they move large amounts of water, but they can also cause extensive habitat loss. Hurricane Ian had a devastating impact on Southwest Florida. It was the fourth deadliest hurricane to hit our state.
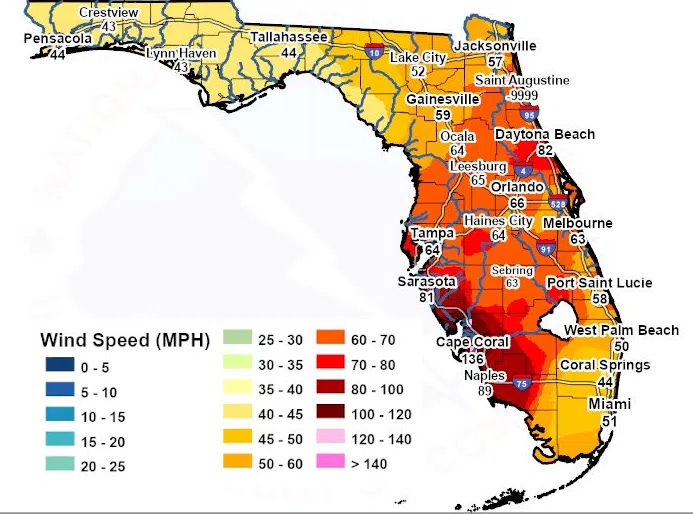
Wind
Hurricane Ian brought winds of up to 81 MPH in Sarasota, with higher speeds in the southern part of the county than elsewhere in our watershed. The area certainly had wind damage, but not the widespread defoliation of the landscape seen back in 2004 with Hurricane Charley, or what happened further south in Charlotte and Lee counties.
Storm Surge
Because of the way the hurricane passed through Florida, our watershed did not have appreciable storm surge.
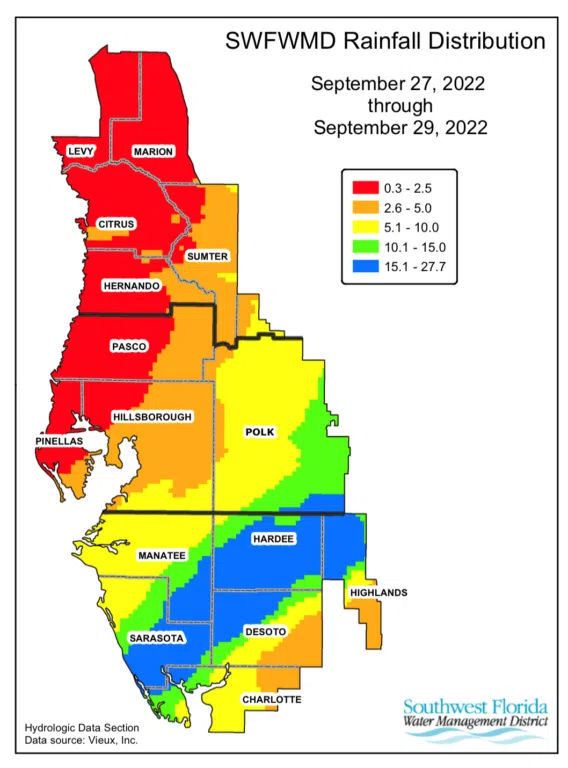
Rainfall
Hurricane Ian did bring a significant amount of rain to our watershed and areas in Central Florida along its path north-eastward. Over a 3 day period, anywhere from 5 - 15 inches of rain fell across the watershed. To put this in perspective, the average rainfall for Sarasota County during the ENTIRE month of September is 7.8 inches. This means some areas received nearly twice the amount of rain in 3 days than they usually receive over 30 days.
What Does More Rain Mean for Sarasota Bay?
Because of the way our cities are designed, much of the rain becomes stormwater and heads towards the nearest drain, canal, or creek and out to body of water. This means our bays and estuaries receive a large pulse of freshwater.

Large pulses of stormwater can create "salinity stratification"
Since freshwater is less dense than saltwater, it will form a fairly distinct layer on top of the saltwater in the bay, causing a separation of the water between top and bottom layers. This does not allow the freshwater, which has oxygen in it from being in direct contact with the air, to mix downward. If there is a large layer of freshwater on top, the bottom layer may also be too dark for algae to photosynthesize and create oxygen. Without mixing or photosynthesis, the amount of oxygen in the bottom water layer can become too low for survival, killing clams, worms and smaller fish.
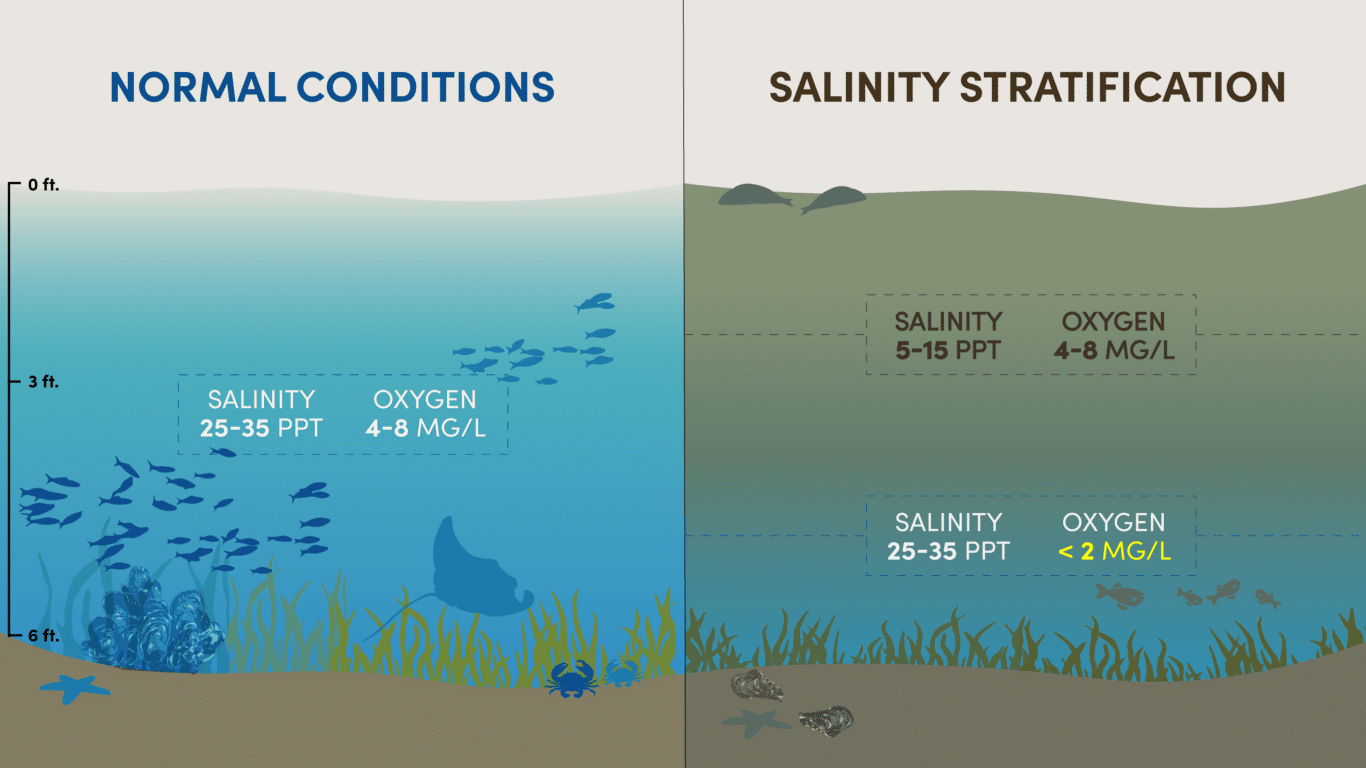
- October 4th (six days after Ian made landfall): sampling in Little Sarasota Bay and southern Roberts Bay showed the salinity on the surface was about 8 to 10 parts per thousand (ppt), while the salinity on the bottom was about 25 ppt. Portions of Lemon Bay exhibited similar stratification as Sarasota Bay, with surface salinities ranging from 11-15 ppt, and bottom salinities ranging from 29-33 ppt. In the months leading up to Hurricane Ian, surface salinities at these locations generally ranged from 33-35 ppt.
- October 12th: The salinity in the surface waters of lower Sarasota Bay started to return to pre-storm levels, but the oxygen problem was getting slightly worse. There were more bottom samples with low oxygen at levels that would be stressful to marine life. The team also noticed a few dead fish, fewer dolphin sightings, and bad smelling water in several areas, mostly in central and northern Little Sarasota Bay. This was anticipated, as Little Sarasota Bay has the longest residence time (how fast or slow water moves through a system). Only about 30% of its water is exchanged after 10 days, the slowest rate of any part of Sarasota Bay.
- October 19th: Surface salinity in Lemon Bay was trending towards pre-Ian conditions, and stratification was lessening throughout the area. Monitoring locations in Lemon Bay saw declines in surface dissolved oxygen compared to the October 4th sample event, but differences in bottom oxygen levels varied; in some cases bottom oxygen actually increased to levels above hypoxic (low oxygen) versus what was observed two weeks prior. It’s important to note that near-surface oxygen concentrations can vary quite a bit throughout the day, with the lowest levels tending to occur prior to sunrise, and the highest concentrations found in mid-late afternoon.
- October 27th: Salinities in Sarasota Bay continued to recover to pre-Ian levels, and water clarity doubled compared to October 4th. The team did not find hypoxic conditions, which means that the bottom waters had recovered enough that fish could likely reclaim the bottom of the bay as a place to swim. Organisms that lived on the bottom and may have died due to prolonged hypoxia were being feasted upon by a combination of crabs and other scavengers like starfish.
- November 17th: Salinities throughout the monitored regions of Upper and Lower Lemon Bay ranged from 28-35 ppt throughout the water column, which is similar to salinities measured in the area pre-Ian. Dissolved oxygen had increased to levels well above hypoxic, in some cases exceeding surface oxygen concentrations measured at these sites pre-storm. Whether this was due to an increase in algal activity in the area will be explored as water managers continue to receive data from samples collected during that timeframe.
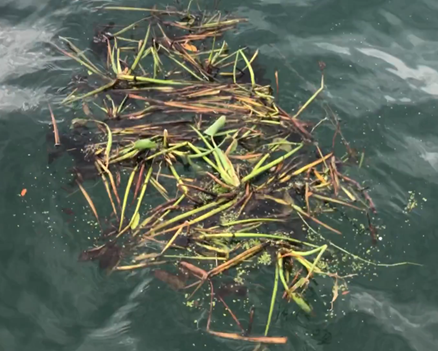
Freshwater Plants in the Gulf!?
As the sampling team headed to the southern bays on October 12th, taking a shortcut through the Gulf, they noticed rafts of freshwater plants like water hyacinth and duckweed floating more than 1 ½ miles offshore. These plants, likely from Cow Pen Slough, shot out into the Gulf during the storm, showing how much freshwater influence the region had from the tens of billions of gallons of rainfall that fell on the watershed. Watch the video.
Large pulses of stormwater may force animals and plants to use more energy to regulate the salt balance in their systems.
If salinity is too low for too long, it can kill marine plants and fish.
Large pulses of stormwater carry bacteria, excess nutrients, and other sources of pollution to the bay
Flipped over porta potties, failed septic tanks, wastewater overflows, dead animals, pet waste, and decaying plant material greatly affect water quality after storm events. Sarasota and Manatee counties had more than 18 million gallons of wastewater overflows as a result of Ian.
ABC News: Floridians still rebuilding 2 weeks after Hurricane Ian - Dave Tomasko, Executive Director of the Sarasota Bay Estuary Program, talks about the recovery efforts happening in Sarasota, Florida.

Bacteria Levels in Blackburn Bay, Little Sarasota Bay & Roberts Bay
The graph below represents the average fecal indicator values on October 4th, 12th, and 27th. The red line represents the “never to exceed” threshold for the fecal indicator bacteria genus Enterococci.
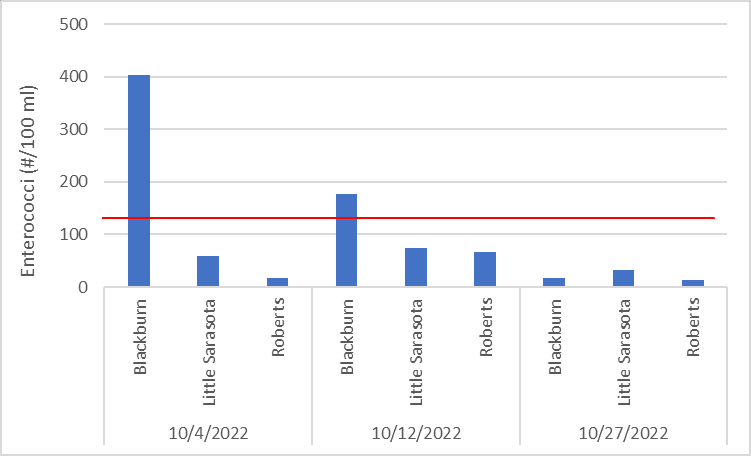
- October 4th: Bacteria levels were elevated in Blackburn Bay, similar to what was found in the Peace River after the passage of Hurricane Charley in 2004. However, they they were not excessively high compared to what had been found in other waterbodies after Hurricane Charley. Bacteria levels in the central and upper parts of Little Sarasota Bay and Roberts Bay were in compliance with state criteria. Overall, levels of indicator bacteria exceeded guidance criteria at about half of the nine sites. The highest levels found were four times the “never to exceed” threshold. In some of the tidal creeks coming into Lemon Bay, bacteria levels were more than 100 times higher than the threshold.
- October 12th: Blackburn Bay had elevated levels of bacteria for more than two weeks after Ian came through. The very high levels in Blackburn likely reflect the impact of discharges from Cow Pen Slough. Inflow from this dramatically expanded watershed (it is now 5 times bigger than it was historically) come north into Blackburn Bay on incoming tides. Those inflows bring massive amounts of freshwater vegetation, including rafts of water hyacinths that were found more than a mile and a half out in the Gulf of Mexico. Along with wastewater overflows from failed lift stations, urban stormwater runoff with its grass clippings and dog poop, those rafts of water hyacinths are decomposed by bacteria, including those within the genus Enterococci. Bacteria counts in much of the locations sampled in Lemon Bay had returned to levels below water quality criteria thresholds, save for Oyster and Buck Creeks in Charlotte County. These streams continued to see impacts from the storm, as staff observed fish kills in neighborhood ponds and debris such as porta-pottys in feeder canals to these systems.
- October 27th: A lot of organic material like dead fish and decomposing oak leaves and grass clippings still remained on the bottom of Sarasota Bay segments feeding bacterial population growth. Buck Creek continued to exhibit excessive bacteria levels, with counts 20x higher than the “never to exceed” threshold. Charlotte County staff are conducting source tracking investigations to determine potential causes.
Large pulses of stormwater can create tannin rich, root beer-like water
The darker looking water that was seen in many of our bays post-Ian was mostly due to tannins, the same stuff that stains swamp waters and gives wine or tea its color. In our bays, these tannin-rich waters were restricted to the top three to five feet of the water column.
Blackburn Bay
Large pulses of stormwater can exacerbate algal blooms and red tide
Stormwater runoff adds nutrients to the bay, which can feed or worsen existing algal blooms. Hurricane Ian also caused an upwelling of deeper water that has a natural nutrient content higher than most surface waters. A big part of managing Sarasota Bay is focused on reducing the amount of algae in our bay. Microscopic floating algae can give the water a greenish tint, reduce water clarity, and result in the loss of seagrass meadows due to light limitation.
How Much Algae Did We Have After Ian?
The graph below shows the average amount of “algae” (represented by chlorophyll-a) in the three lower bay segments over time. The red line represents the target level for the lower bay. Very high levels of floating microscopic algae (aka “phytoplankton”) were seen for at least two weeks after the storm, but declined quite substantially by the third week. So why did we have so much algae in the water column? Because the amount of algae is related to the availability of nitrogen, and we loaded a lot of nitrogen into the water after Ian.
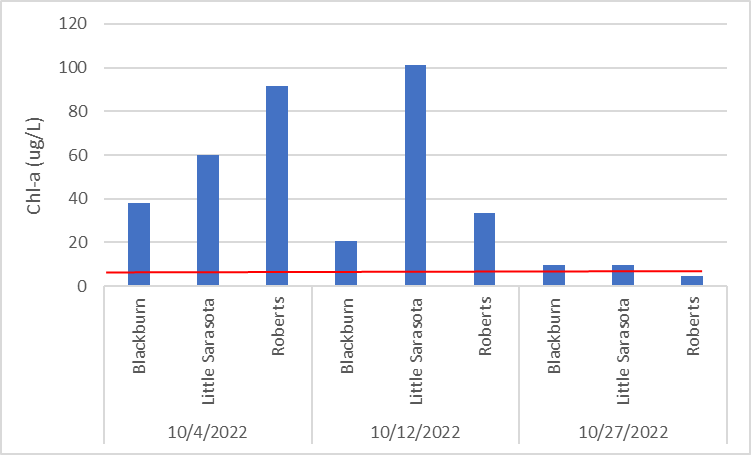
- Oct 4th: Surface waters at sample sites had very high levels of oxygen, which suggested there were high rates of photosynthesis from algal blooms. When the laboratory data came back, it did indicate that the levels of phytoplankton (floating microscopic algae) were as much as ten times higher than our targets for the lower bay.
- Late October: High red tide levels (> 1 million cells/liter) were detected offshore of the Venice Inlet. Several areas in the Gulf of Mexico from Venice Inlet down to Boca Grande had medium to high values.
- Early November: Satellite imagery (below) suggests a phytoplankton bloom in excess of 100 square miles offshore, from southern Sarasota Bay down to Boca Grande. In this image, the orange and red indicate higher levels of plant pigments, or algal blooms. The Florida Fish and Wildlife Conservation Commission maps (in video below) also show high levels of Karenia brevis, or red tide, in the same general areas as the satellite imagery shows the algal blooms. What does this all mean? We don’t yet know. But we do know algal blooms that originate way offshore in the Gulf of Mexico (like red tide) can be made worse if they are transported to our coast by prevailing winds and currents and then fed by land-based nutrients.
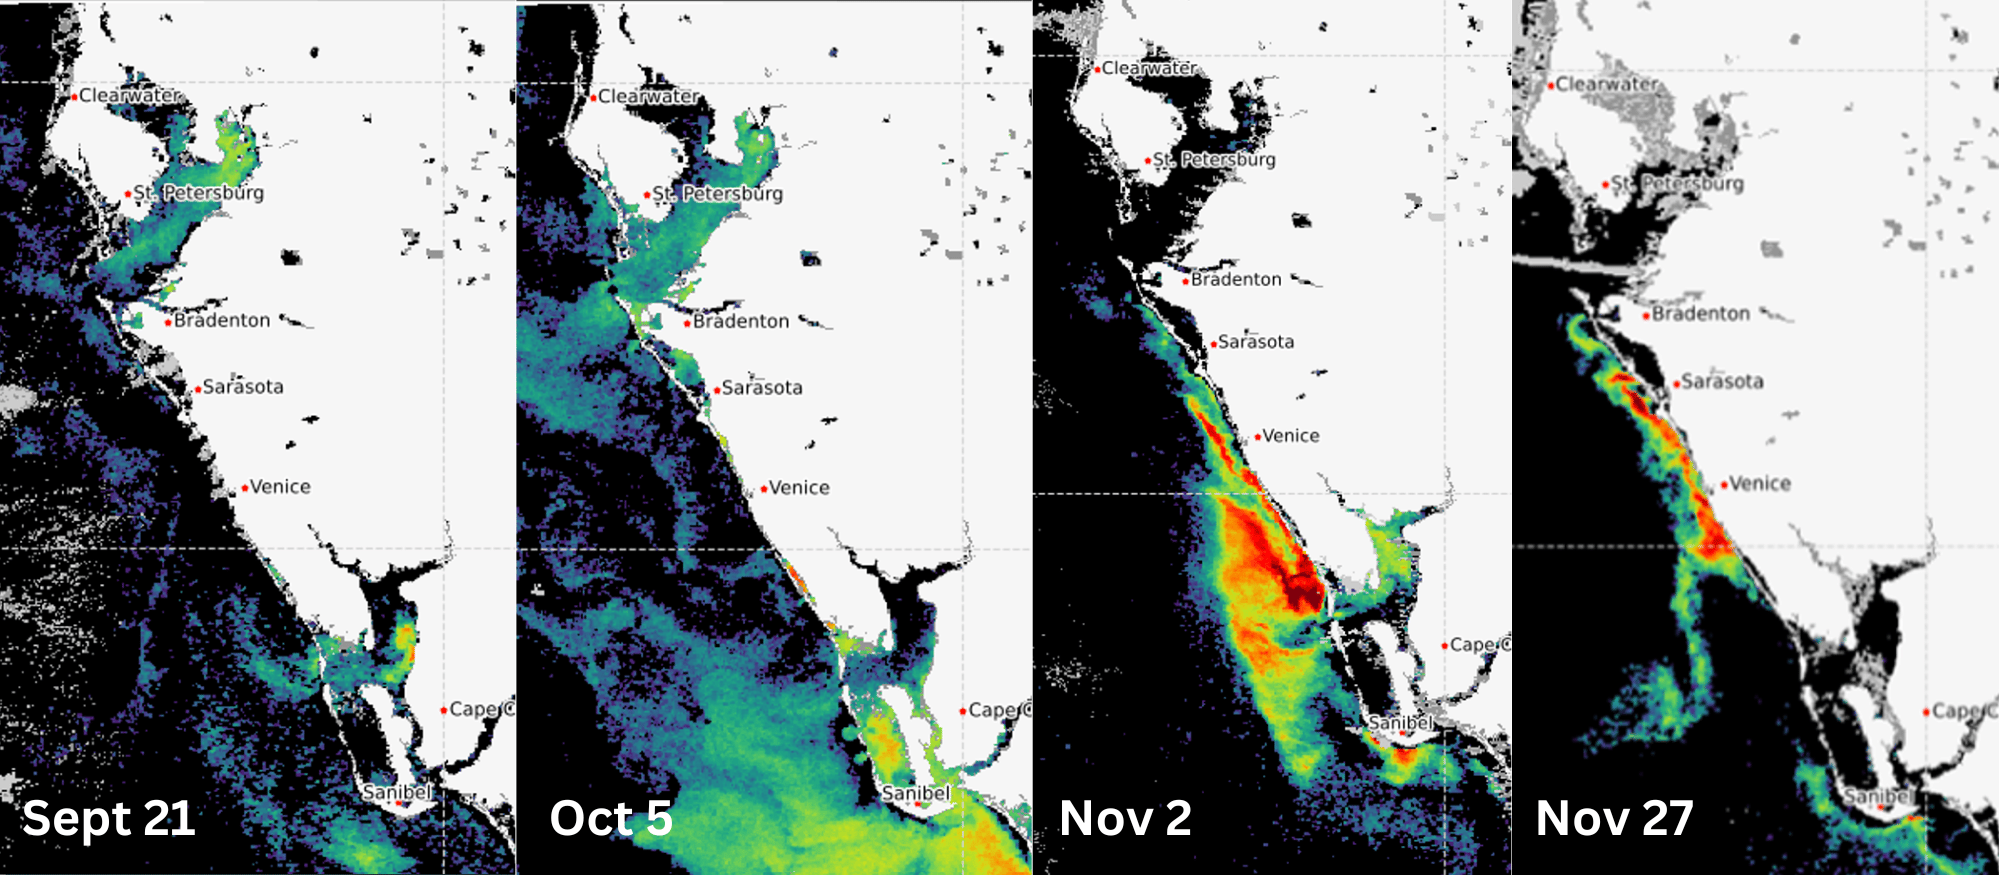
Red tide before and after Hurricane Ian; Credit: Florida Fish and Wildlife Conservation Commission (some data may be provisional)
How are Storms Changing?
Wetter Storms
Warmer air holds more moisture. As the climate becomes warmer, we are seeing more potential for extreme rainfall events in conjunction with hurricanes and tropical storms.
More Frequent, Stonger Storms
Hurricanes are basically heat engines. They take the thermal energy, or heat energy, contained within warm water and warm moist air and convert it into wind and waves. As our air and water become warmer, there is more thermal energy in our oceans and coastal waters to fuel stronger storms and cause them to intensify faster.
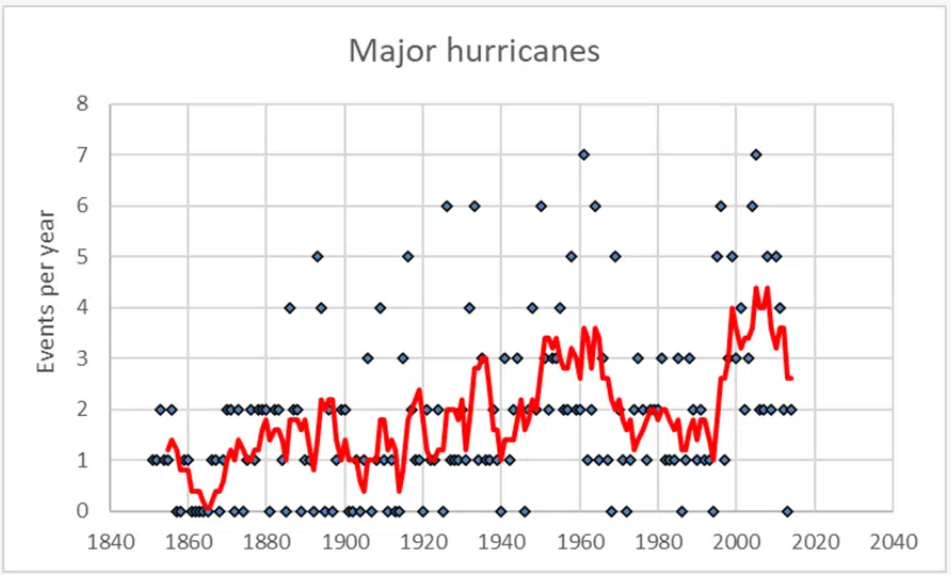
Major hurricanes have been recorded in our area since before the Civil War. They are not anything new. However, we are starting to see more of them. The red line in the graph tells us that the frequency of major hurricanes has been higher on average in the last 20 years than any prior period, going back 150 years. In addition, we are seeing less and less years with zero major hurricanes recorded in the North Atlantic Basin.
More Storm Surge
Storm surge is mostly caused by storm-force winds pushing water onshore. As stronger storms become more frequent, coupled with rising sea levels, there is potential for higher storm surge. In parts of Naples and Ft. Myers, Hurricane Ian's surge reached record levels.
Resilient Estuaries

The good news is that nature is resilient by design. Estuaries are a great example of this because they experience shifts in salinity, temperature, and other characteristics on a regular basis as the seasons and tides change. Although Sarasota Bay has taken a hit by recent storm events, it doesn’t mean the bay’s health is at serious risk of collapse. A healthy Sarasota Bay will be able to recover from the impacts of Hurricane Ian, if the impacts work through the system over a period of time. Our job is to do eveything we can to keep the bay healthy so that it can continue to bounce back after these kinds of events.
In 2021, Sarasota Bay had the best water quality in the last 5 to 15 years (depending on location). That improvement was made possible by a combination of stormwater retrofits, habitat restoration efforts, and upgrades to our wastewater infrastructure. Because we were healthier in 2021 and in the first months of 2022, we were better able to handle the impacts of Hurricane Ian than we would have been five or ten years ago.
"A healthier bay is a more resilient bay. Since storms such as Ian are more likely over the next 20 years than they were the last 20 years, staying as healthy as we can will be even more important in the future as it is now." - Dr. Dave Tomasko
A big thank you goes out to staff from Charlotte County, the Southwest Florida Water Management District, ESA, Benchmark Laboratories, and the Coastal and Heartland National Estuary Partnership for their help in developing this rapid response water quality sampling effort on top of all of the recovery work already going on.
Click here to read Sarasota Bay Health Updates
Click here to read about Hurricane Ian's impact in Charlotte Harbor